
Welcome to Portfolio Manager’s Challenge, an interactive web‑based game that lets you test and sharpen your investment‐management instincts across a variety of realistic scenarios. This manual walks you through everything you need to know: from launching your first game to mastering every mode.
1. Quick‑Start Checklist
Open the game: https://aagame.acclimetry.com/
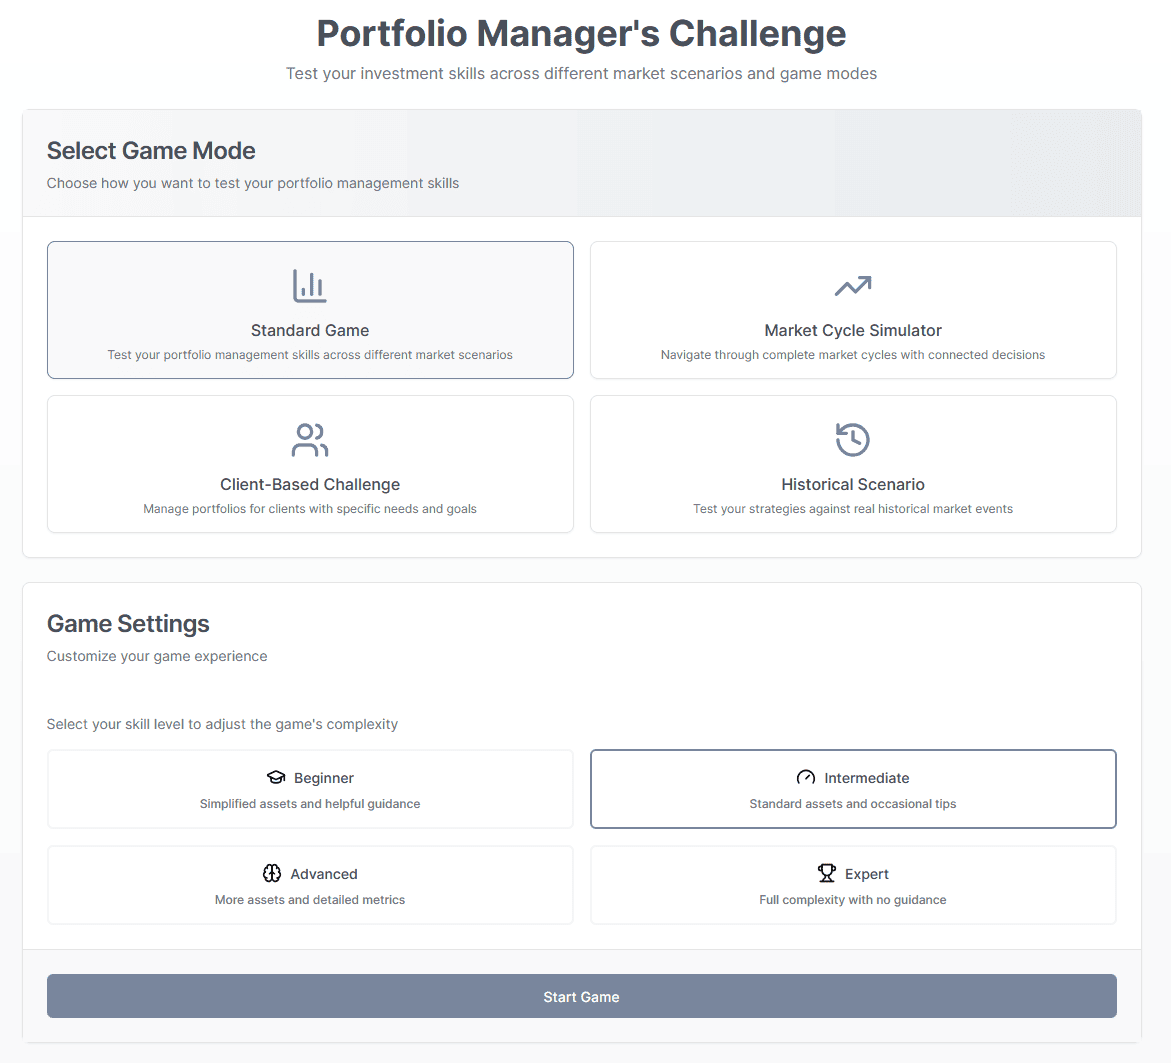
Choose Start Game → Select a Game Mode.
(Details in section 3.)Pick a Skill Level (Beginner → Expert).
The higher the level, the more asset classes and the fewer hints you’ll see.Hit Start. Allocate 100 % of capital using the sliders, then submit.
Review results, iterate through rounds / phases, and aim for a new high score!
2. The Game Screen at a Glance
| Zone | What you’ll see | Key actions |
|---|---|---|
| Scenario / Phase Card (left) | Current round/phase, market description, remaining allocation bar, Submit & Next buttons | Study the scenario; track remaining %. |
| Allocation Panel (right) | Doughnut chart + asset sliders | Drag sliders until Remaining hits 0 %. |
| Results Panel | Pops up after you submit | Inspect returns, scores, and performance charts. |
(Layout resizes responsively on mobile.)
3. Game Modes
3.1 Standard Game – Asset Allocation Challenge
Objective: Outperform the benchmark by allocating across 5–7 core asset classes for N rounds (default = 5). Each round throws a random market scenario (Bull, Bear, Recession, Inflation Surge, Stable Growth).
Scoring: Your total return ×10, adjusted for risk; bonus for hitting scenario‑specific sweet spots. High scores persist in your browser.
Tips:
– Diversify early; sliders move in 5 % increments.
– Watch the remaining % indicator—allocations must sum to 100 % before you can submit.
3.2 Market Cycle Simulator
Objective: Navigate an entire macro cycle (Boom → Peak → Contraction → Recovery). Each decision carries forward, so poor positioning compounds!
Unique Twist: Past round results influence future starting capital and risk limits.
When to play: Perfect for practicing dynamic asset re‑balancing.
3.3 Client‑Based Challenge
Objective: Satisfy a specific virtual client’s goals and deliver returns across 4 market scenarios.
Workflow:
Select Client → review age, goals, risk tolerance, constraints.
Allocate Portfolio in line with their profile.
Monitor two metrics each round: Portfolio Return and Client Satisfaction.
Scoring:
Round Score = (Return ×5) + (Δ Satisfaction ×2).Pro‑tips:
– Don’t chase maximum return if it breaches the client’s max‑risk %.
– Income generation & liquidity matter for retirees and near‑term goals.
3.4 Historical Scenario Challenge
Objective: Relive famous crises—Dot‑com Bubble, 2008 GFC, COVID‑19 crash, 2022 Inflation Shock—and see if you can beat history.
Structure: Each scenario splits into phases (e.g., Bubble → Peak → Crash). Allocate before seeing the actual returns.
Features:
Historical asset returns bar chart.
Contemporary news headlines toggle.
Cumulative return line graph vs. historical average.
Scoring: Combines phase return ×10 with a history proximity bonus (the closer your total return is to the real‑world average, the bigger the bonus).
4. Skill Levels & Their Effects
| Level | Asset set | Guidance | Data granularity |
|---|---|---|---|
| Beginner | 3–5 broad assets | On‑screen tips & highlighted risk bars | Basic (%) returns only |
| Intermediate (Default) | Core 5–7 assets | Occasional hints | Adds charts and risk labels |
| Advanced | 8–10 assets incl. EM, HY bonds, gold | No hints | Displays risk, income, liquidity metrics |
| Expert | Full asset universe | No guidance | Access to extra analytics & econ indicators |
5. Scoring, High Scores & Progress Tracking
Score formulae vary by mode but always reward higher risk‑adjusted return.
High Score saved locally; clearing browser cache resets it.
View round/phase‑level performance tables and line charts in the Performance History section after finishing a game.
6. Frequently Asked Questions
Q : Why can’t I click Submit?
A : Ensure the Remaining indicator reads 0 %—you must allocate exactly 100 %.
Q : Sliders feel cramped on mobile.
A : Rotate to landscape or use the doughnut chart legend to tap‑select an asset and fine‑tune.
Q : How is risk measured?
A : Each asset carries an internal volatility score (hidden at Beginner, shown at Advanced+). Round risk is a weighted sum.
7. Glossary
Asset Class – Group of securities with similar traits (e.g., stocks, bonds).
Bull/Bear Market – Sustained rising/falling price trend of 20 %+.
Cumulative Return – Aggregate % gain/loss across rounds/phases.
Client Satisfaction – Proxy score (0‑100) measuring alignment with a client’s objectives.
Phase Proximity Bonus – Extra points for matching historical market performance in Historical mode.
8. Feedback & Support
Have suggestions or found a bug? Message us from our Contact page: https://acclimetry.com/contact/
Happy allocating—and may your Sharpe ratio be ever in your favour!
—The Acclimetry Team